

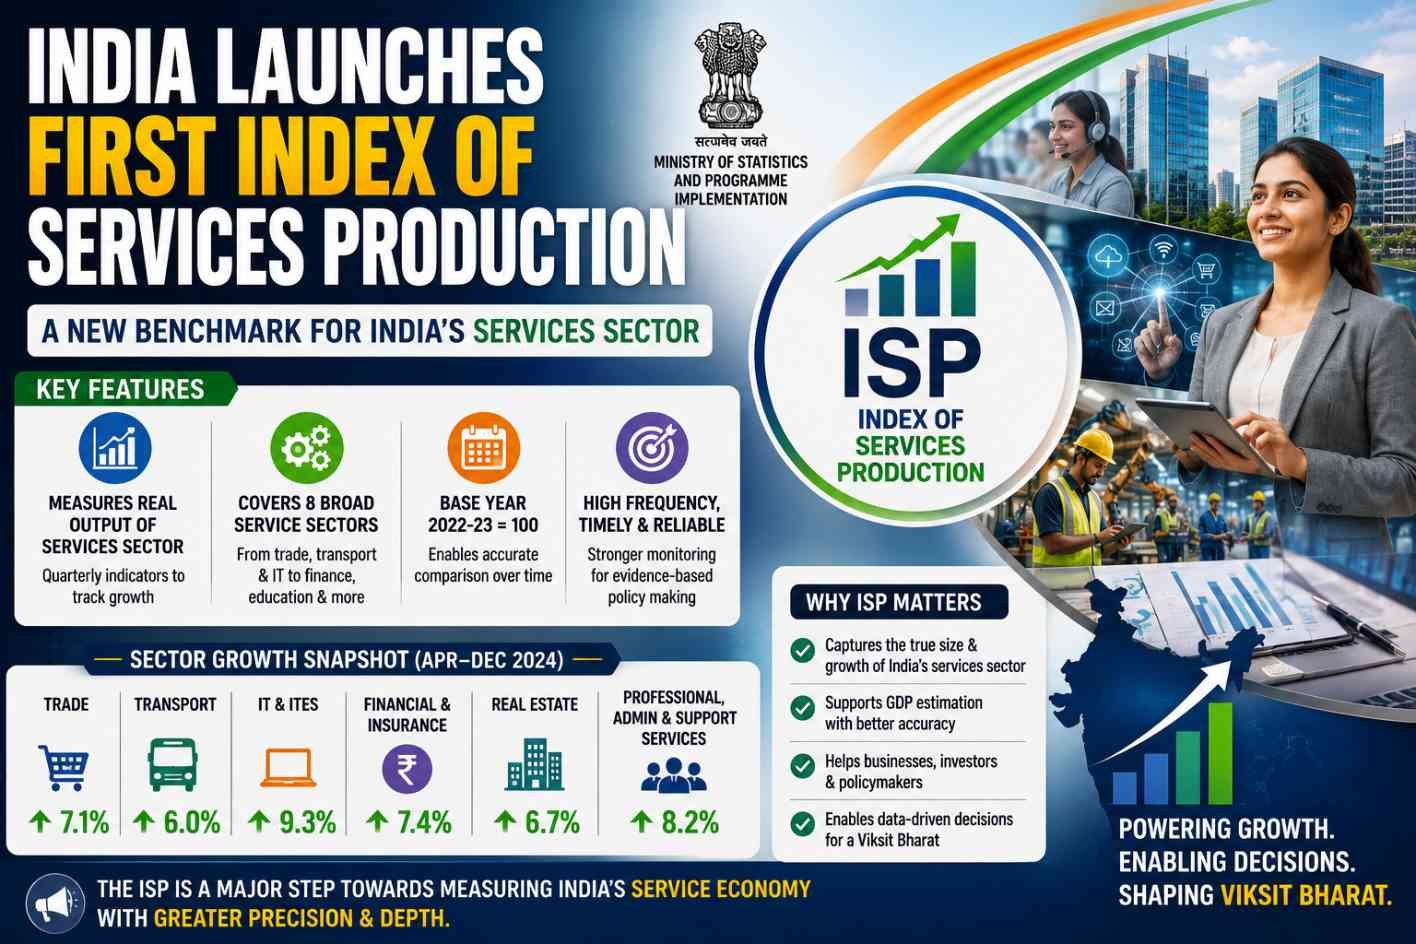
- The Government of India has released the country’s first trial Index of Services Production, creating a new high-frequency indicator to measure short-term changes in output across the formal services sector.
- The inaugural trial index covers 19 service sub-sectors for April 2026, represents nearly 60% of India’s services economy, and uses 2024–25 as its base year. The Ministry of Statistics and Programme Implementation plans to release the trial series every month with a lag of around 60 days.
- The new indicator fills a major gap in India’s economic data system. While the Index of Industrial Production measures short-term activity in mining, manufacturing and electricity, India previously lacked a comparable monthly measure dedicated to services—the largest component of the economy.
What Is the Index of Services Production?
The Index of Services Production, or ISP, measures short-term changes in the volume of services produced by the formal sector compared with a selected base year.
It is designed to indicate whether activity in areas such as retail trade, telecommunications, transport, banking, real estate, hospitality and professional services is increasing or declining.
The index is an output indicator. It should not be treated as equivalent to Gross Value Added used in calculating GDP. GVA measures the value created after subtracting intermediate consumption, whereas the ISP primarily tracks movements in the volume of service output.
April 2026 Services Growth: Top-Performing Sectors
The first trial release pointed to broad-based expansion across India’s formal services economy. Fourteen of the 19 covered sub-sectors registered double-digit growth in April 2026 compared with April 2025.
The five fastest-growing sub-sectors were:
| Service sub-sector | April 2026 annual growth |
|---|---|
| Accommodation and food services | 37.2% |
| Retail trade | 30.8% |
| Administrative and support services | 28.7% |
| Real estate activities | 27.7% |
| Telecommunications | 22.8% |
Accommodation and food services emerged as the fastest-growing category, indicating strong activity in hotels, restaurants and related businesses. Retail trade followed with growth of 30.8%, while administrative support, real estate and telecommunications also reported significant expansion.
Top Service Sectors During 2025–26
The trial series also identified the strongest-growing service categories during the full financial year 2025–26.
The top five were:
- Accommodation and food services: 35.6%
- Retail trade: 30.5%
- Repair services: 25.1%
- Wholesale trade: 23.6%
- Road transport: 22.6%
These numbers indicate that consumer-facing activities, trade and transportation were among the major drivers of formal services growth.
Why India Needed a Services Production Index
Services have remained the largest contributor to India’s economy for more than a decade. Their share in national Gross Value Added stood at approximately 52.9% in 2024–25. The sector also accounts for around 30% of employment and has generated an estimated 40 million jobs during the past six years.
Despite this importance, policymakers had no dedicated monthly output index for monitoring short-term developments across the sector.
The existing Index of Industrial Production provides timely information about factories, mines and electricity generation, but it does not capture activity in services such as:
- Retail and wholesale trade
- Hotels and restaurants
- Banking and insurance
- Telecommunications
- Information technology
- Real estate
- Transportation
- Professional services
The ISP therefore gives policymakers, economists, researchers and businesses a more complete view of current economic activity.
What Is the Base Year of the ISP?
- The base year for the trial Index of Services Production is 2024–25.
- A base year provides the reference point against which subsequent changes in production are measured. Choosing a recent base year helps ensure that the index reflects the current structure of the economy, including newer business models and the expanding role of digital services.
- The 2024–25 reference period also aligns the ISP with other statistical updates and newer price-index series being developed by the government.
How Frequently Will ISP Data Be Released?
- MoSPI plans to publish regular monthly trial indices with a lag of approximately 60 days.
- The data is expected to be released on the 29th of each month, or on the following working day when the 29th is a holiday. The government will evaluate the consistency and stability of the trial data before introducing a comprehensive final index.
- The monthly frequency will allow economic ministries and analysts to identify emerging trends much earlier than through annual surveys.
How Is the Index Calculated?
- Many service providers report their business activity in monetary terms, such as revenue, turnover or transaction value.
- However, higher revenue does not always mean that more services were produced. Revenue can also rise simply because prices increased.
- To measure actual output growth, statisticians must remove the effect of inflation through a price deflator.
- In simple terms:
- Real service output = Nominal service value adjusted for price changes
- This conversion transforms value-based data into volume-based estimates and gives a clearer indication of whether service activity has genuinely expanded.
Which Price Deflators Are Used?
Different deflators are being used depending on the nature of each service category.
- Wholesale Price Index is used for wholesale trade.
- Relevant Consumer Price Index categories are used for most other services.
- CPI-General is applied to repair and maintenance, banking and insurance.
- CPI-Services is used when a closely matching sector-specific price index is unavailable.
This sector-specific approach is intended to produce a more accurate estimate of real output.
Which Services Are Currently Excluded?
The initial trial index excludes several sectors where reliable monthly data is unavailable or where activities are dominated by government, non-market or informal operations.
Excluded categories include:
- Public administration and defence
- Central banking and certain other financial activities
- Money market funds
- Social work without accommodation
- Membership organisations
- Personal services
- Activities of households employing domestic workers
- Extraterritorial organisations
- Government-provided health and education
- Gambling and betting activities
The coverage is expected to expand as additional administrative and survey-based datasets become available.
Coverage Could Rise to 85–90%
The current trial index covers around 60% of the services sector.
MoSPI expects to broaden the framework over time by adding areas such as private health services, education and ownership of dwellings. This could eventually take the index’s coverage to around 85–90% of the formal services sector’s economic contribution.
However, officials have emphasised that the present data should be treated as a trial series rather than a final, fully developed index.
Difference Between ISP, IIP and GDP
| Indicator | What it measures | Frequency |
| ISP | Short-term change in formal services output | Monthly trial series |
| IIP | Output in mining, manufacturing and electricity | Monthly |
| GDP/GVA | Overall value created across the economy | Quarterly and annually |
The three indicators serve different purposes.
The ISP will complement rather than replace GDP estimates or the Index of Industrial Production. Together, they can provide a broader and timelier assessment of India’s economic momentum.
How ISP Will Help Policymakers
A monthly services indicator can improve policy decisions by enabling authorities to:
- Detect slowdowns or recoveries earlier
- Monitor consumption-related activity
- Improve quarterly GDP and national accounts estimates
- Evaluate the impact of policy measures
- Track formalisation of the services economy
- Compare performance across service industries
- Design sector-specific interventions
For example, a sudden decline in accommodation, transport or retail activity could signal weakening consumer demand. Strong growth in telecommunications or computer services could indicate accelerating digitalisation.
Benefits for Businesses and Researchers
The index will also be useful to private-sector decision-makers.
Companies may use it to:
- Benchmark industry performance
- Assess demand conditions
- Plan investments and expansion
- Track competitor sectors
- Improve revenue forecasts
- Identify emerging areas of growth
Researchers and economists will gain access to a more detailed and frequent dataset for analysing India’s structural transformation.
International Practices Followed
The Technical Advisory Committee formed by MoSPI in May 2025 developed the conceptual and methodological framework with reference to international practices.
The government reviewed guidance from the OECD Compilation Manual for the Index of Services Production and Eurostat’s statistical framework.
Several advanced economies already publish comparable indicators. The United Kingdom compiles a Monthly Index of Services, while South Korea releases a monthly Service Industry Activity Index. Countries including France, Spain and Slovenia also publish services-production indicators.
Why the First Release Is Only a Trial Index
The government has described the present series as a trial because service-sector measurement is complex.
Challenges include:
- Differences in business models across industries
- Dependence on value-based administrative data
- Selection of appropriate price deflators
- Data revisions
- Incomplete coverage of informal services
- Need to test seasonal and long-term stability
Public release of the trial series allows economists, businesses and other stakeholders to examine the methodology and provide feedback before the final index is introduced.
Why the Index of Services Production Matters
- The ISP marks a major shift in how India measures economic activity.
- India’s statistical system has traditionally had stronger high-frequency indicators for agriculture, manufacturing, trade and prices than for service output. The new index begins to correct this imbalance.
- Its significance lies in three areas:
- Better Economic Monitoring: Monthly data will provide an earlier picture of whether India’s largest economic sector is accelerating or slowing.
- Improved National Accounts: The index can strengthen the information used for estimating quarterly output and Gross Value Added.
- Evidence-Based Policymaking: Sector-level data will help the government design more targeted responses during economic disruptions.
Key Highlights of the Index of Services Production
- India’s first dedicated high-frequency services output indicator
- Covers 19 formal service sub-sectors
- Accounts for nearly 60% of the services sector
- Base year fixed at 2024–25
- First trial data released for April 2026
- Fourteen sub-sectors recorded double-digit annual growth
- GST data used extensively for the first time in official statistical applications
- Monthly trial data to be released with a lag of approximately 60 days
Conclusion
- The launch of India’s first Index of Services Production is an important milestone in modernising the country’s economic measurement framework.
- With 19 sub-sectors, a 2024–25 base year and nearly 60% coverage of the services economy, the trial index provides a new window into the performance of India’s largest economic sector.
- The first release indicates strong momentum, with 14 sub-sectors registering double-digit growth in April 2026. Accommodation and food services, retail trade, administrative support, real estate and telecommunications recorded the fastest expansion.
- As coverage improves and the trial series stabilises, the ISP could become one of India’s most closely watched monthly economic indicators alongside inflation, industrial production and employment data.